Crypto Overview
Reversal IQ works, and you can prove it yourself.
Reversal IQ comes with its own backtester, allowing you to verify the accuracy of Reversal IQ before deciding to use it.
Tip
For quick verification of Reversal IQ's performance, just take a look at the top-right table showing the profit factor.
Settings
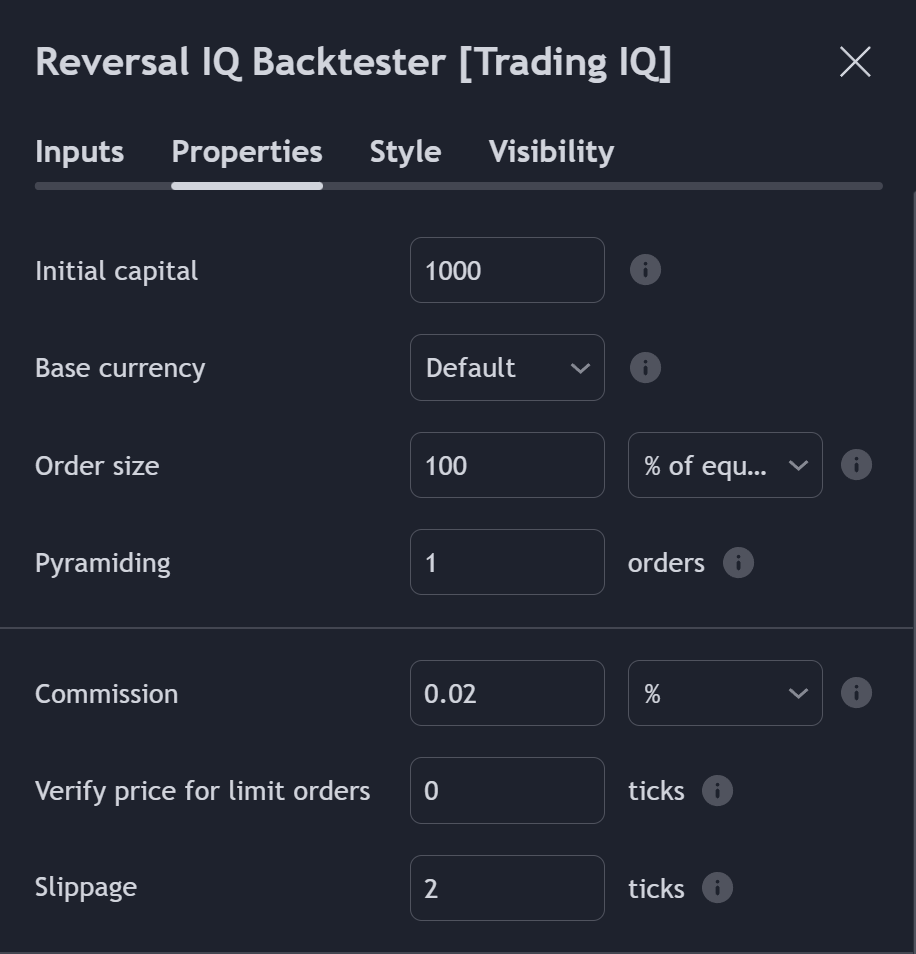
All cryptocurrency performance tests will use the following settings: 
Generally, cryptocurrency brokerages provided tiered-fees. The lowest-tier maker fee (worst maker fee) across most brokerages is 0.02% - which will be used for all cryptocurrency backtests. If you're account has a higher VIP level and lower fees, then the historical performance of Reversal IQ will be even better for your account!
Additionally, a slippage of 2 ticks is used. These settings are used to account for real-world trading conditions and better simulate a realistic application of Reversal IQ. Our backtests will take place in highly-liquid markets, so it's realistic to leave "Verify Price For Limit Orders" at 0 ticks. In less liquid markets, where an order might not fill immediately, it's important to use this setting!
Additionally, we chose an initial balance of $1000 and using 100% of capital per trade. These conditions were selected to show the effects of compounding performance and simulate common leverage amounts such as 20x, 50x, 100x.
Note
You have complete control over verifying the accuracy of Reversal IQ. You can change the commission value to the real commissions you pay, increase slippage, and more.
Tip
When looking at backtest data, the dollar-amount profit and dollar-amount drawdown are less important than other metrics, as the raw-dollar amount profit and raw-dollar amount drawdown are highly specific to the trader's balance. Instead, it's more important to evaluate percentage metrics and ratio metrics, such as the profit percentage, profit factor, and drawdown percentage - these metrics are relatively consistent across various balances. Additionally, risk-performance metrics such as the Sharpe Ratio are good indications of a strategy's viability.
Note
All of our backtests will show a green line. The green line is the performance of Reversal IQ. Some of our backtests will include a blue line. The blue line is the buy-and-hold performance of the asset. What's important here is that the green equity curve (Reversal IQ) outperforms the blue equity curve (asset). If it does, this means Reversal IQ is more profitable than simply buying the asset and holding it!